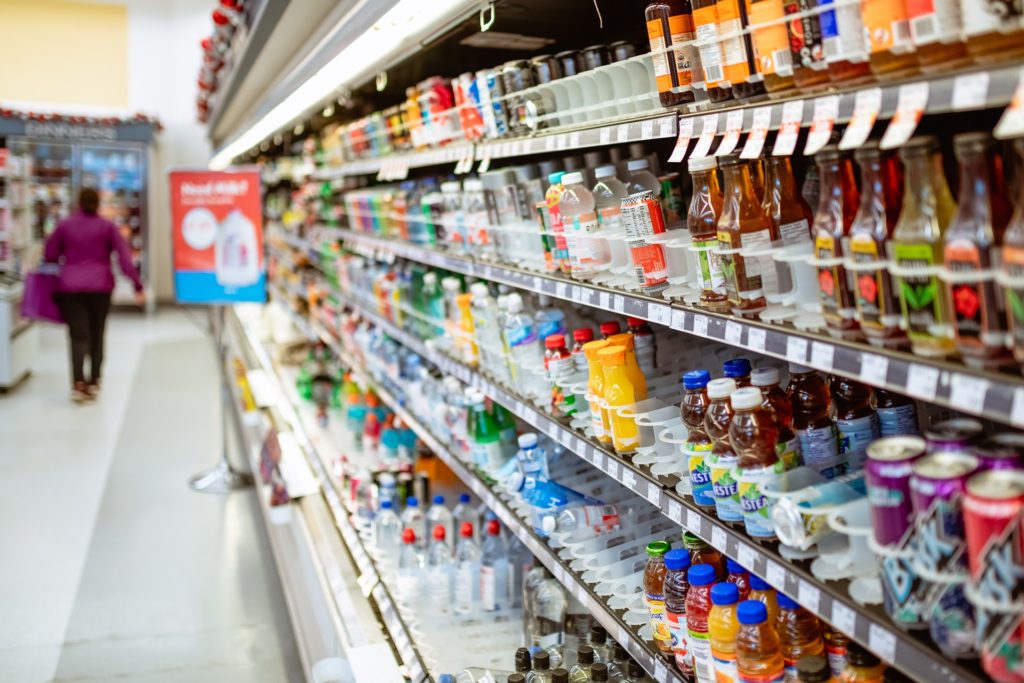
Chemicals
Chemicals are in the products we buy and consume, in industrial processes, in agricultural production; they are all around us when we live and work. But there is growing concern about their impacts on health and the environment.
Policy implications
The “big picture” indicators potentially provide useful snapshots of the pressures being exerted by Swedish consumption. If they are updated regularly, they can also help to answer the central Generational Goal question of whether Sweden is reducing its international health and environmental footprint without increasing it abroad.
Chemical indicators could potentially be used for Sweden to prioritize international cooperation to address issues of upstream chemicals management, emissions control and broader industrial development.
The breakdown by product group can also help to identify those sectors where work needs to be strengthened. For example, construction features prominently across the big picture indicators (as well as for many other PRINCE indicators). As the global urbanization trend continues, including in countries such as Sweden, the use of hazardous chemicals in buildings and the construction sector in general is an area that requires further attention.
The big picture hazardous chemicals indicators could also be developed for use at international levels, in relation to the sustainable consumption and production agenda, or to support work on chemical labelling, EU regulations on chemical management, or the evolving EU non-toxic environment strategy. If all EU member states were to use joint indicators of the PRINCE type, these would help to guide the continued efforts of the EU to reduce risks from hazardous chemicals by highlighting key product groups and trade routes in the hazardous chemical footprint.
As with most chemical legislation in Sweden, the use of pesticides and VMPs is subject to EU regulation, specifically the EU Plant Protection Products Regulation and the EU pharmaceutical legislation for medicinal products for veterinary use. But there is also room for national or local policy initiatives for example related to sustainable consumption initiatives.
Better, more comprehensive and reliable international cooperation to improve data gathering and access in relation to hazardous chemicals could greatly improve the reliability of indicators like these. At the conclusion of the first PRINCE project, further development was required for the chemicals indicators before they could be included in regular monitoring.
New consumption-based indicators
In the first phase of the PRINCE project, a team of international researchers has developed a set of “extensions” that can be plugged in to the PRINCE model in order to produce policy-relevant macroindicators for hazardous chemicals-related pressures around the world linked with Swedish consumption.
These indicators break new ground in several ways:
- “Big picture” indicators pulling together a wide variety of chemical substances
- National consumption perspective
- Allocation of the pressures to different product groups consumed in Sweden
- Using a multiregional input-output (MRIO) approach to show where pressures fall along the whole supply chains for Swedish consumption
The PRINCE hazardous chemicals indicators attempt to address several key challenges. The first is the large and growing range of chemical compounds currently being used. Each of these compounds may have very different toxicity characteristics. The “cocktail effects” of different chemicals in combination add another dimension of uncertainty. Finally, there is the diversity of reporting and regulatory systems, management practices and compliance around the world.
Three of the indicators use different ways to capture a big picture of chemical-related pressures due to Swedish consumption. Two others zero in on two classes of hazardous chemicals that are topics of particular concern in relation to food and agriculture: pesticides and antimicrobial veterinary medicines. The indicators draw on different data sets and use somewhat different methodologies, and consequently have their own strengths and weaknesses. The indicators and data sources are described in the drop down table below.
The hazardous chemical products covered are in four hazard classes in the Swedish environmental accounts (“corrosive”, “toxic”, “harmful” and “health hazard”). Pesticides, pharmaceuticals, cosmetic products and fossil fuels are not included.
One key weakness is that it cannot capture the huge variety of processes and “recipes” that can be found in the same industrial sector around the world. Also, the conversion factors are based on hazardous chemical product use in Swedish industries in 2013, which will probably lead to underestimates for many countries. It is also limited as a proxy for actual chemical impacts, as it does not reflect how well the chemicals are managed and any measures to mitigate impacts.
As the size of the indicator for a given industry or country depends so much on the economic data, it is not surprising that the largest pressures are found in other EU countries.
Further development of chemicals indicators in PRINCE phase 2
Phase 2 of the PRINCE project (completed in the spring of 2022) built on the work of the first PRINCE project in the chemicals area by developing time series for consumption-based indicators for the use of veterinary medical products (VMP, i.e.antibiotics), pesticides for food production, and the use of hazardous chemical products (HCPs).
For VMPs and pesticides, the analysis has demonstrated the possibility for producing official statistics with the methods developed. The experimental time series for consumption-based VMPs and pesticides show that the majority of use arises due to Sweden’s imports instead of from domestic production.
These findings are coherent with the fact that Sweden has amongst the lowest levels of antibiotic and pesticide use in the world. This is further in spite of the fact that economically Sweden’s domestic food production is still larger than food imports. Between 2008 and 2019 VMP use due to Swedish consumption has decreased by almost 50%. Over the same time period, pesticide use has decreased by 12 %.
The analysis also showed that a majority of Sweden’s consumption-based use of hazardous chemical products also arose due to imported products. Further methodological development is necessary before consumption-based HCPs use are considered for official statistics.
Indicator: Use of hazardous chemical products
This indicator estimates the aggregate quantities of hazardous chemical products used in producing goods and services for Swedish consumption. It has consistent worldwide coverage, because it assumes that chemical use in an industrial sector involved in production is the same anywhere in the world, and thus applies the same conversion factors to the global economic data in the PRINCE model. It is easy to update as new economic data appears.
According to European Union statistics, the EU produces around 200 million tonnes of chemicals that are potentially hazardous to health every year, and around 120 million tonnes of chemicals potentially hazardous to the environment. Most countries have some regulations that try to minimize the risks that hazardous chemicals pose to workers in the industries that use them, to the surrounding environment, and to consumers.
However, as globalized trade grows, the factories and farms using chemicals may be far away from the jurisdictions where the goods are consumed, separated by long and complex supply chains. The scope of the regulations, and capacity to monitor and enforce compliance can vary widely around the world. Voluntary reporting initiatives exist (e.g. the industry initiative Responsible Care®) but again, their coverage is patchy
In Sweden most of the legislation on chemicals is regulated at the EU level, and therefore common to all EU member states. However, measuring progress towards this goal is complicated by the lack of any system of indicators that can quantify the chemicals being used internationally to meet Swedish demand, where they are being used or what impacts they might be having.
This indicator aggregates the reported emissions of hazardous chemicals into nature. The extensions are based on the emissions data found in the EXIOBASE MRIO model, which includes 437 different emission types for 35 substances), based on national reporting. This data is supplemented with data from the EU and OECD pollutant release and transfer registers (E-PRTR and PRTR). For those countries not participating in either register, emissions were estimated.
The focus on emissions means the indicator can better reflect management practices, particularly waste management, in the industries. For this indicator, it is suggested that different emissions are aggregated based on mass. This means that the indicator does not differentiate between substances based on how hazardous they are. The quality of national data and the reliance on estimates also adds uncertainty, particularly for countries outside the EU and the Organisation for Economic Co-operation and Development (OECD).
This indicator uses the same data sources as Emissions of hazardous substances, but weight them to reflect human toxicity and ecotoxicity, using the Usetox model. Of the “big picture” PRINCE macroindicators, this come closest to measuring impacts. However, they are subject to the same reporting gaps as Emissions of hazardous substances. They also cannot account for cocktail effects or local conditions.
Once again, this weighting substantially changes the geographic and product group hotspots. Notably, 24% of the ecotoxicity pressures fall inside Sweden, the largest share of any of the hazardous chemicals indicators.
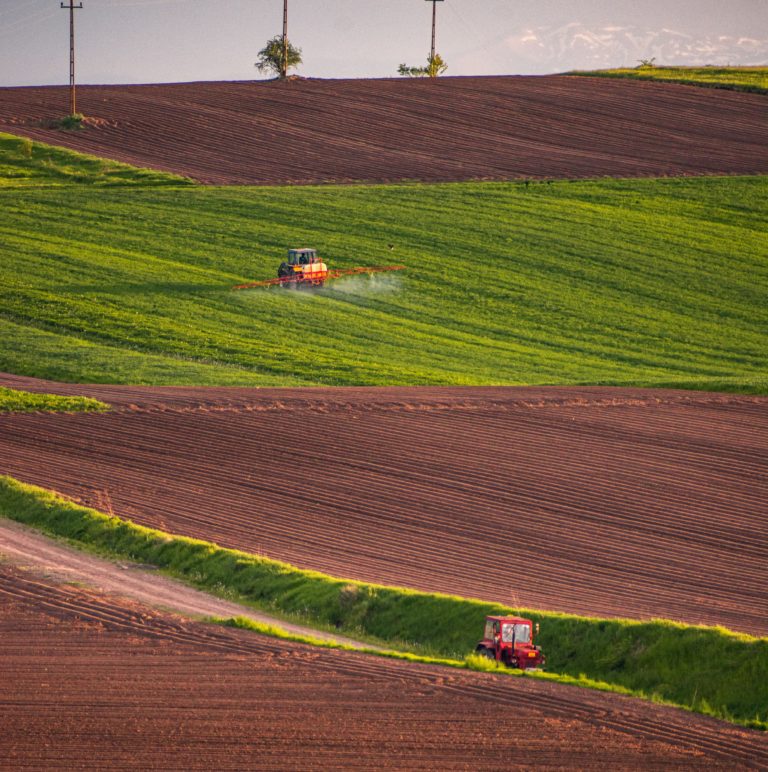
Pesticides reach the natural environment almost exclusively in the form of diffuse emissions (e.g. run-off from a field after rain). These emissions are difficult and costly to measure, and today many countries lack knowledge about the quantities of pesticide residues in their ecosystems. Therefore, a use-based indicator is the best.
The Use of pesticides indicator builds on data from an international registry (FAOSTAT). It can thus reflect differences between countries, but not per crop, as the data is given as aggregate sums for the countries. Non-responses are common in the registry, especially among developing countries. Nevertheless, as it uses the FAOSTAT data, the indicator can be further disaggregated to different categories of pesticide – including the most important herbicides, fungicides and insecticides.
Agricultural products and food products naturally appear as the main hotspot product groups for Use of pesticides (and primarily in Sweden and the EU). A case study in PRINCE, the use data were reallocated to different categories of food consumed in Sweden, revealing that the largest pesticide footprints were related to fruits and vegetables.
The (over)use of antimicrobial veterinary medicine products (VMPs) in livestock production has attracted much concern due to the possible long-term public health consequences of antimicrobial resistance.
This indicator builds on data from a unique European data collection and reporting system on VMP use. As there is no other widespread reporting system for VMP use outside the EU, the EU averages were used for livestock production outside the region.
This was the only hazardous chemicals indicator for which Sweden was not one of the top two hotspot countries.
Watch Linn Persson presentation (in Swedish)
Indicators, data sources and units for the PRINCE hazardous chemicals indicators
| Indicator | Unit | Data source |
| Use of hazardous chemical products | t. product (per hazard class) / yr | System of Economic and Environmental Accounts (Statistics Sweden) |
| Use of pesticides | t. a.i. /yr | FAOSTAT |
| Use of veterinary medicine | t. a.i. /yr | ESVAC |
| Emissions of hazardous substances | t. a.i. / yr | EXIOBASE, E-PRTR and PRTR |
| Potential impact of emissions of hazardous substances, with sub-indicators for human toxicity and ecotoxicity | For human toxicity: CTUh For ecotoxicity: CTUe |
EXIOBASE, E-PRTR and PRTR |
a.i. = active ingredients CTUe = PAF (potentially affected fraction) x m³ × day per year CTUh = disease cases per year ESVAC = European Surveillance of Veterinary Antimicrobial Consumption E-PRTR = European Pollutant Release and Transfer Register PRTR = OECD Pollutant Release and Transfer Register t. = metric tonne
Outputs
-
 01 Feb 2019
Developing a chemicals footprint for Sweden
Indicators for national consumption-based accounting of chemicals Steinbach, N., Palm, V., Cederberg, C., Finnveden, G., Persson, L., Arvidsson, R., Berglund, M., Cederberg, C., Finnveden, G.,…
-
 17 Jan 2019
Human- and eco-toxicity footprints for Sweden
Updated indicators of Swedish national human toxicity and ecotoxicity footprints using USEtox 2.01 Nordborg, M., Arvidsson, R., Finnveden, G., Cederberg, C., Sorme, L. Palm, V.,…
-
 07 Feb 2019
Chemicals footprint for Sweden
Using E-PRTR data on point source emissions to air and water—First steps towards a national chemical footprint Sörme, L., Palm, V. and Finnveden, G. (2016). Environmental…